Creating maps with Stata
Stunting Prevalence
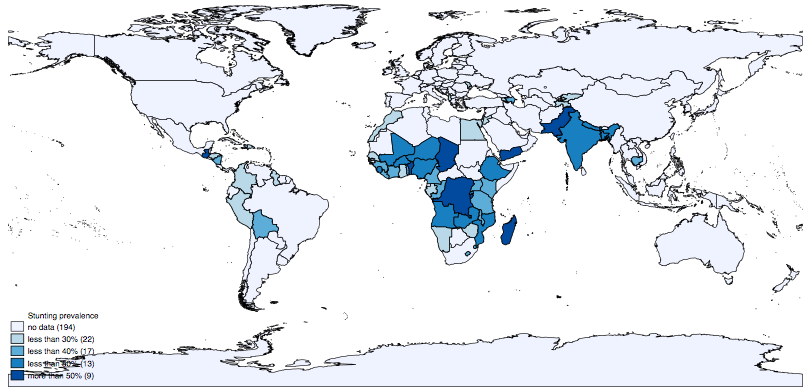
Here you can learn how to create the map shown above using Stata. All material necessary to reproduce the map is available for download.
Want to learn more?
Check out this blog post by Asjad Naqvi, which also explains more in detail the basics of creating maps in Stata, including some tips and a FAQ on maps: https://blogs.worldbank.org/impactevaluations/making-visually-appealing-maps-stata-guest-post-asjad-naqvi
You can find a more detailed description of working with the command spmap here: https://www.stata.com/meeting/italy14/abstracts/materials/it14_pisati.pdf
Material for creating maps in Stata
Attribution: Shape files (World Bank Official Boundaries) are from the Data Catalog of the World Bank Group. World Bank Official Boundaries is a public dataset, under Creative Commons Attribution 4.0